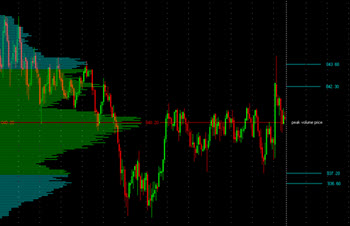
A chart displaying a moving average – also known as rolling average or running average – is created by forming a series of averages of different subsets of the full data set. It is a finite impulse response filter.
Several different types of moving averages can be created in addition to the simple moving average, such as the weighted moving average and the cumulative moving average.
 Simple moving average
- The first element is the average of the initial fixed subset of the number series.
- This subset is then modified through a “forward shift”, i.e. the first number of the series is excluded and the number located after the original subset is included instead. You will now have a new subset of numbers and your next step is to calculate an average for them.
- Repeat this process over the entire data series.
- Mark the averages on a chart and connect the marks with a line. This plotline is the moving average.
Why use a moving average?
A moving average is typically used to smooth out short-term fluctuations and make longer-term trends or cycles easier to spot.
Among technical analysts, moving average charts are created for both price, volume and returns.
Example
Closing price for the last five days: $10 – $14 – $20 – $12 – $11
We want to create a 3-day moving average.
$10 – $14 – $20 = $44
44 / 3 = 14,67
$14 – $20 – $12 = $46
46 / 3 = 15,33
$20 – $12 – $11 = $43
43 / 3 = 14,33
Instead of getting a chart with a high peak ($20) in the middle, we get a chart where the marks stay well within the 14 – 16 range.
A moving average can help the technical analyst to not be eluded by false trading signals.
Some traders employ a model where they buy the stock as soon as the price goes above an established moving average and sell the stock as soon as it dips below an established moving average. N.B! Relying on this method in a non-trending market can become very costly.
Technical analysis summary
- A technical analyst studies historical trading data, especially prices and volume, with the aim of accurately predicting future movements.
- Charts are an important tool within the field of technical analytics. By studying charts instead of raw data, the analyst hopes to spot patterns that might otherwise go unnoticed.
- Examples of commonly used chart types are the line chart, the bar chart and the candlestick chart.
- Moving average is a method that can be used to smooth out the data, making overall trends more noticeable and short-term spikes less influential.
This article was last updated on: August 28, 2016
