Technical analysts will typically try to establish resistance and support lines for the price of a stock, option or other security. This is not a scientific concept that can be explained by a formula or similar – it is more of an art and a skill that a trader can become better at with experience.
The resistance line
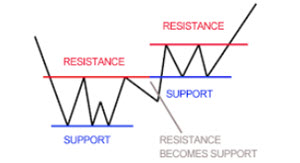 Look at your line chart where you can see the highs and the lows. Now, draw a line that connects all the highs. This is known as the resistance line. The idea is that it will be difficult for the price of the stock to breech the resistance line and climb higher. That’s because as the share price gets near the resistance line, there will be plenty of sellers willing to sell, compared to the number of buyers willing to buy. Many stock holders will notice that the price is high and want to lock-in their profits by selling, while many potential buyers become more reluctant to buy since they also notice that the price is high and thus prefer to stand back and hope for it to drop a bit before they make a purchase.
If the price manages to break through a resistance line, technical analysts will pay close attention to this, since it can be an indication of one or more sellers not being willing to sell at the resistance line price anymore or that they’ve now sold all their shares, thus diminishing the supply of shares. Sometimes, a break through is a sign of good news being released or upbeat rumors being spread.
In general, a technical analyst will see a resistance line break through as a signal to buy shares.
The support line
Look at your line chart where you can see the highs and the lows. Now, draw a line that connects all the lows. This is known as the support line. The idea is that it will be difficult for the price of the stock to fall below the support line. That’s because as the share price gets near the support line, there will be plenty of traders willing to buy, compared to the number of sellers willing to sell. (Or a single buyer willing to absorb all shares offered at this price.) Many traders will notice that the price is low and be enticed to buy, while many potential sellers are reluctant to sell at the low price – they rather wait and hope for the price to go up a bit.
If the price manages to fall through a support line, technical analysts will pay close attention to this, since it can be an indication of one or more buyers not being willing to buy at the support line price anymore. It can also be a sign that sellers are becoming more eager to get rid of their shares. Sometimes, it is a sign that an individual buyer that until now has absorbed all the shares offered is no longer present, at least not at that price level.
Sometimes, a fall below the support line is a sign of bad news being released or negative rumors being spread.
In general, a technical analyst will see a fall below the support line as a signal not to buy shares, since it could be the beginning of a sharp decline in share price.
Volume
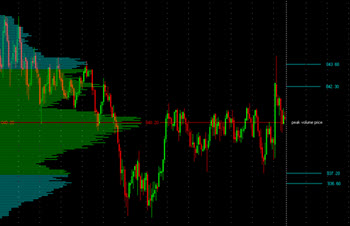 When trying to interpret the movements of the stock market in order to accurately predict the future, volume is an important aspect that should be taken into account.
For instance, if we notice that a break in the support line (price falls below the support line) roughly coincides with an increase in volume, that will generally be an indicator that strengthens our suspicion that even lower drops will occur in the nearby future, and that a new – lower – support line is about to be established.
Knowing exactly why the volume is increasing is difficult, since it can be due to several factors – or a combination of factors. To make the situation even more complex, these various factors have a tendency to interact with each other.
If the stock is in an upward trend, a distinct increase in volume can for instance be due to larger and more sophisticated investors having spotted the upward trend and deemed it strong enough to warrant major purchases.
The rising triangle
Technical analysts are on the look out for various patterns and there is a long host of patterns that – allegedly – can help us foretell future price movements. One of the most well-known ones is the Rising Triangle, a shape caused by a rising support line in combination with a flat resistance line. In other words, each high mark is on the same level as the previous high mark while each low mark is on a higher level than the previous low mark.
The Rising Triangle indicates two things:
- There has consistently been enough shares available for sale at the market at the high-price level to prevent an upwards break through. When someone is willing to pay the high price, there is a seller available that will accept that price.
- Buyers looking for a low price are getting increasingly willing to pay more. Why that is, we can not know.
This is usually interpreted as a sign of prices being on an upwards trajectory. It is not a clear upwards trend since the resistance line isn’t moving up; it is more of a pre-sign that tells us that an upwards trend might be about to take form – especially if the Rising Triangle is accompanied by an increase in volume. If the volume is stable or decreasing, the picture becomes more difficult to read.
This article was last updated on: August 28, 2016