Top 5 Candlestick Patterns for Trading Stock Indices

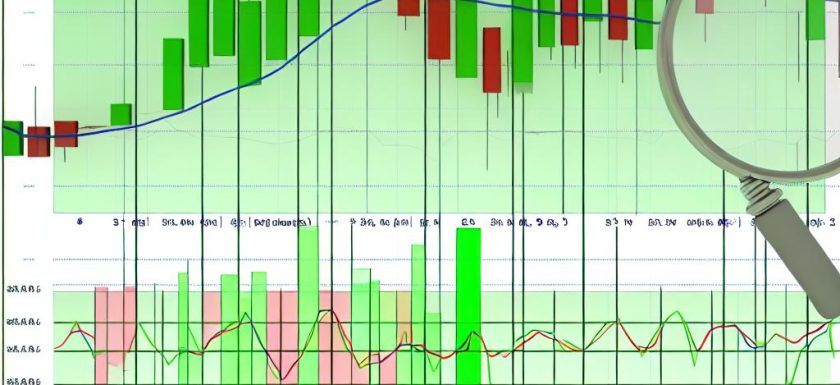
Introduction to Candlestick Patterns in Stock Indices Candlestick patterns are essential tools for traders analyzing stock indices. These patterns provide visual cues about market sentiment and potential future movements in the prices of indices like the S&P 500, Nasdaq, and Dow Jones. In this article, we will explore the top five candlestick patterns that are commonly used by traders in assessing stock indices. 1. Bullish Engulfing Pattern The bullish engulfing pattern occurs when a small bearish candle is followed by a larger bullish candle, completely engulfing the previous day’s body. This pattern suggests that the bulls have overtaken the bears, indicating potential upward momentum. TradersRead More →

Moving Averages: How They Help in Index Technical Analysis

Understanding Moving Averages Moving averages are statistical tools widely utilized in the field of technical analysis. They are instrumental in offering a clearer picture of price data by maintaining a constantly updated average price. Such methods are particularly beneficial when working with indices. Traders and analysts often employ moving averages to discern market trends, identify potential buy or sell signals, and interpret market behavior over specific time frames. The Concept of Moving Averages The main principle behind moving averages is their ability to filter out the “noise” that stems from random short-term market fluctuations, thereby emphasizing the true direction of a trend. This functionality isRead More →

How to Identify Trend Reversals in Stock Market Indices

Understanding Trend Reversals in Stock Market Indices Identifying trend reversals in stock market indices forms a cornerstone for traders and investors who seek to optimize their entry and exit points in the market. Recognizing these pivotal shifts can greatly influence investment outcomes, enabling more efficient risk management as well as maximizing potential profits. This nuanced understanding of market trends supports more strategic decision-making in the fluid environment of stock trading. What are Trend Reversals? A trend reversal in the stock market context signifies a pivotal change in the direction of a prevailing market trend. When a stock index that has been consistently moving upward beginsRead More →

Understanding Support and Resistance Levels in Index Charts

Introduction to Support and Resistance Understanding support and resistance levels is a fundamental aspect of technical analysis in trading. These concepts are widely applied to index charts and play a crucial role in determining potential market movements. Traders use these levels to make informed decisions about entry and exit points. Recognizing these patterns can be the difference between profitable trades and losses for both beginner and professional traders alike. Definition of Support and Resistance Levels Support is a price level where a downtrend can be expected to pause due to a concentration of buying interest. As the price drops towards support, buyers become more likelyRead More →

How to Use Technical Indicators for Index Trading

Understanding Technical Indicators Technical indicators serve as vital analytical tools within the realm of financial markets, specifically aiding traders in interpreting price movements and forecasting potential future price trends of financial instruments like index funds. Derived from historical price data, these indicators are integrated into chart patterns and offer traders invaluable insights to make informed trading decisions. However, it is important to note that these indicators should not be relied upon in isolation. Instead, they function optimally when incorporated into a comprehensive trading strategy that accounts for various market elements and conditions. Types of Technical Indicators Technical indicators are broadly categorized into distinct types, eachRead More →