Overview of Nasdaq 100
The Nasdaq 100 stands as a pivotal index within the global financial markets, representing 100 of the largest non-financial companies traded on the Nasdaq Stock Market. Its composition heavily leans towards sectors fueled by technology and innovation, making it of particular interest to many investors and market analysts. The Nasdaq 100 acts as a barometer for the health and performance of the tech industry due to the inclusion of leading technology firms. Consequently, analyzing the patterns and trends within this index provides not only insights into the broader economic picture but also indications of the direction in which technological advancements could steer economic growth.
One of the primary appeals of the Nasdaq 100 is its ability to reflect the dynamic nature of industries characterized by rapid technological changes and consumer demands. Companies within this index are often leaders in innovation and exhibit a propensity for robust growth. This positions the Nasdaq 100 as a critical gauge for assessing potential shifts in market trends based on real-time data and evolving market sentiment.
Technical Analysis Fundamentals
Technical analysis plays a crucial role for those who wish to anticipate future price movements based on past market behaviors. Unlike fundamental analysis, which examines a company’s financial health, technical analysis focuses on statistical trends extrapolated from historical price and volume data. The aim is to garner predictions about future price dynamics by studying the footprints left by market participants.
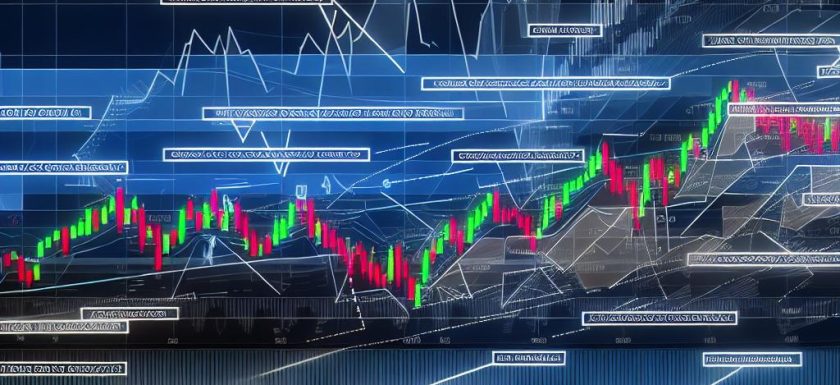
Technical analysts employ various tools to distill sentiment from charts, interpreting visible indicators to formulate predictions. These tools include various chart patterns and indicators that can yield reveals about market inclination and potential reversals. By engaging in technical analysis, traders and analysts can craft strategic approaches based on the historical tendencies identified within the price data.
Key Patterns in Nasdaq 100
In the realm of technical analysis, several key patterns are particularly insightful when evaluating the Nasdaq 100. Recognizing these patterns can serve as an essential skill set for traders wishing to dominate the market’s ebb and flow.
Head and Shoulders
Among the multitude of patterns, the head and shoulders is heralded as a precursor to trend reversals. This pattern typically materializes at the peak of an uptrend with three peaks: the central peak or the ‘head’ being the tallest, flanked by two ‘shoulders’ of lesser height. In the context of the Nasdaq 100, the appearance of this pattern can hint at a reversal, urging traders to brace for a potential shift from bullish to bearish market conditions, or vice versa.
Double Top and Double Bottom
The double top and double bottom patterns are also integral indicators of potential market reversals. A double top can surface following an upward trend and signals a downturn. Conversely, a double bottom emerges after a downward trend, indicating a likely bullish reversal. These patterns often serve as confirmation tools for traders assessing the Nasdaq 100, allowing them to juxtapose current market conditions against historical behaviors to predict future directions.
Triangles
Triangles, as technical patterns, are valuable during market consolidations, signifying that a breakout is on the horizon. This broad category is refined into ascending, descending, and symmetrical patterns. Each type illustrates distinct underlying market forces. In the Nasdaq 100, the formation of a triangle often foreshadows the likelihood of continuation of the prevailing trend. Traders closely observe for breakouts either upwards or downwards, using these signals to strategize future market actions, bolstered by the knowledge of upcoming movements.
Indicators Complementing Chart Patterns
In addition to visual chart patterns, quantitative indicators provide a depth of analysis that augments the technical analyst’s arsenal. By integrating indicators, traders and analysts add a layer of verification to their interpretations.
Moving averages, a staple of technical analysis, facilitate the identification of underlying trends by smoothing out fluctuations in price data. They enable a clearer view of trend directions by considering historical price actions over set periods. In examining the Nasdaq 100, analysts might employ different types of moving averages such as simple or exponential to confirm suspected trends conveyed by patterns.
The Relative Strength Index (RSI) is another powerful instrument. This momentum oscillator helps traders ascertain the speed and magnitude of price movements. It identifies overbought or oversold scenarios which, when aligned with chart patterns, can herald a shift in the prevailing trend.
The MACD, or Moving Average Convergence Divergence, is pivotal in revealing momentum changes. As a trend-following momentum indicator, it showcases the relationship between two moving averages of a security’s price and is instrumental in identifying potential buy or sell opportunities within the Nasdaq 100 landscape.
Conclusion
Mastering technical analysis, particularly within the scope of the Nasdaq 100, offers financial professionals and traders nuanced insights into market dynamics and trends. The synergy between chart patterns and technical indicators gives investors a robust framework to adapt and thrive amid market shifts. Through a meticulous understanding of head and shoulders, double tops and bottoms, triangles, and other patterns, alongside indicators like moving averages, RSI, and MACD, traders can enhance their decision-making processes.
Although these technical tools and strategies do not guarantee market success, they significantly increase the likelihood of making informed decisions based on empirical evidence rather than conjecture. As investors and traders continue to harness the knowledge encapsulated within technical analysis, they are better equipped to navigate the complexities and volatilities inherent in financial markets, particularly within innovation-centric indices like the Nasdaq 100. For those seeking deeper expertise, a multitude of resources and educational materials can be found across financial education platforms, offering continued growth and learning in the realm of technical analysis.
This article was last updated on: May 11, 2025