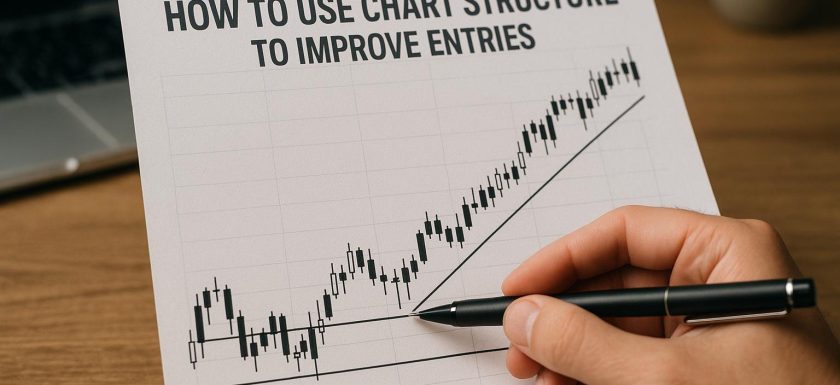
How to use chart structure to improve entries

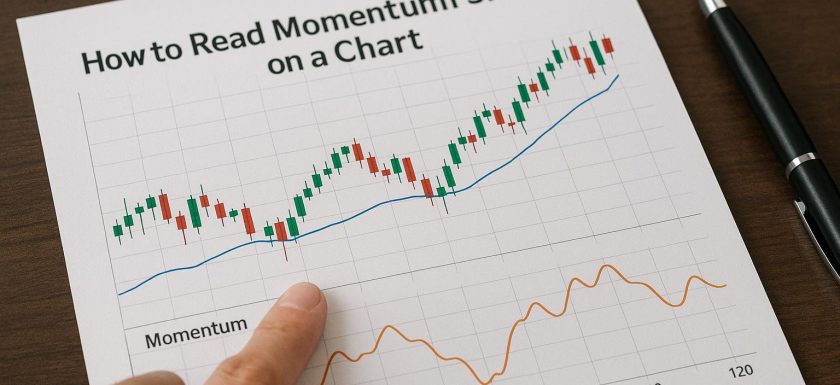
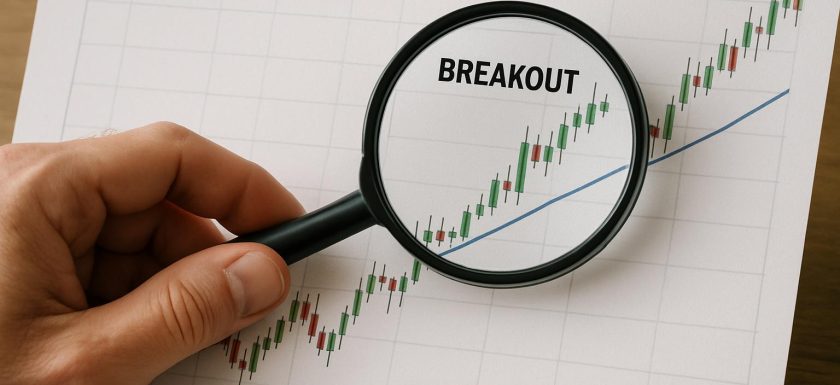
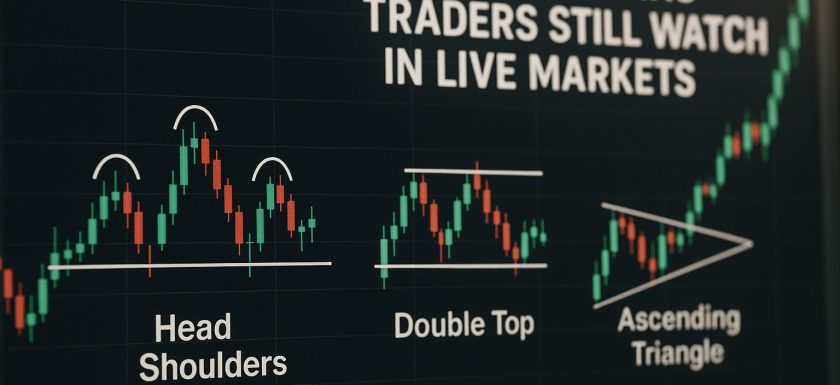
Understanding Chart Structures Chart structures are indispensable tools for traders and investors when it comes to making informed entry decisions in the financial markets. A chart structure essentially refers to the arrangement and pattern of price movements over time, typically represented by candlestick charts, bar charts, or line charts. These structures form the backbone of technical analysis, offering valuable insights into potential future price movements. Types of Chart Patterns In the vast realm of technical analysis, chart patterns play a crucial role as visual representations of historical price movements. By understanding these patterns, traders can make educated predictions about future price directions. Chart patterns canRead More →

How to identify choppy conditions before taking a trade

Understanding Choppy Market Conditions In the world of trading, one often encounters various market conditions that can influence decision-making processes. Among these is the phenomenon known as a choppy market, which is characterized by indecisive price movements, lacking a clear upward or downward trend. Such conditions present unique challenges and can be particularly frustrating for traders, especially those who rely on clear directional movement to capitalize on price fluctuations. Recognizing choppy market conditions before committing to a trade becomes crucial to managing risks and avoiding potential losses. Key Indicators of Choppy Conditions Identifying choppy market conditions demands a keen observation of several key indicators. TheseRead More →

How to read range bound markets with more confidence

Understanding Range Bound Markets Range bound markets, often referred to as sideways or non-trending markets, present unique challenges and opportunities for traders. These markets are characterized by prices that oscillate between well-defined boundaries known as support and resistance levels. In contrast to trending markets where assets exhibit a clear directional movement, either upwards or downwards, range bound markets lack such definitive trends. As such, understanding the intricacies of these markets can significantly enhance a trader’s ability to make informed decisions and boost overall trading confidence. Traders often encounter range bound markets when financial instruments, such as stocks, currencies, or commodities, trade within a specific priceRead More →

How to spot trend continuation setups in technical analysis

Understanding Trend Continuation in Technical Analysis In the realm of technical analysis, identifying trend continuation setups plays a pivotal role for traders aspiring to harness ongoing market movements effectively. By discerning these setups, traders can predict the market’s trajectory more accurately, enabling more strategic positioning and enhancing the potential for profitable trades. Defining Trend Continuation Trend continuation is observed when an existing market trend, whether it’s aiming upwards or downwards, continues to follow its recognized path. This occurs without significant deviation from its established direction. Traders and analysts employ a range of indicators and chart patterns to confirm whether an ongoing trend is likely toRead More →

How to read momentum shifts on a chart

Understanding Momentum Shifts on a Chart Reading momentum shifts on a chart is critical for analyzing and predicting market trends. Momentum refers to the speed or force of an asset’s price movement and can be a reliable indicator of market strength. What are Momentum Shifts? Momentum shifts occur when there is a change in the speed at which an asset’s price is moving. This can indicate a potential reversal or the continuation of a trend. Identifying these shifts can help traders make informed decisions about entering or exiting trades. Indicators of Momentum Shifts Several technical indicators can help identify momentum shifts: 1. Moving Averages: MovingRead More →

How to recognise fake breakouts before they trap you

Understanding Breakouts in Financial Markets Breakouts are a critical concept in financial markets, marking the moments when the price of an asset decisively moves above a resistance level or below a support level. These thresholds often represent barriers where the price has historically had difficulty advancing beyond or falling below. In essence, breakouts signify a potential shift in the market’s dynamics, opening the door to trading opportunities. Traders across the world focus on breakouts, anticipating that these movements will continue in the direction signified by the breakout’s path. Yet, not all breakouts follow through, making it vital for traders to differentiate between genuine and falseRead More →

How to trade pullbacks with better timing

Understanding Pullbacks in Trading In the realm of trading, a pullback represents a temporary reversal in the prevailing trend of a financial asset, providing traders an opportunity to enter the market and ride the trend. Successfully trading pullbacks requires precise timing and an understanding of market dynamics. The Basics of Pullback Trading A pullback is a minor decline or pause in the price movement of a financial asset during its broader uptrend or downtrend. This pause does not signify a trend reversal but rather a momentary market correction or consolidation. Identifying the end of a pullback accurately allows traders to position themselves advantageously. Traders useRead More →

How to spot clean breakouts on a price chart

Understanding Breakouts in Price Charts Spotting clean breakouts on a price chart is a critical skill for traders and investors, providing opportunities to capitalize on significant price movements. A breakout occurs when the price of an asset moves above a resistance level or falls below a support level with high volume. Understanding these concepts can guide decision-making in trading. Identifying Support and Resistance Levels The first step in spotting breakouts is identifying support and resistance levels on a chart. Support is a price level where a downtrend can be expected to pause due to a concentration of demand. Conversely, resistance is where an uptrend canRead More →

How to use trend lines without drawing nonsense everywhere

Understanding Trend Lines in Technical Analysis Trend lines serve as fundamental components in the realm of technical analysis, offering invaluable insights to traders and investors alike. These lines, simple in nature yet profound in their utility, provide a visual representation of market behavior. By illustrating the general direction and velocity of price movements, trend lines aid in making informed trading decisions. In this expanded discussion, we delve deeper into the methods of efficiently using trend lines while avoiding the pitfalls of cluttered charts. Identifying Key Points In technical analysis, the utility of trend lines stems from their ability to connect pivotal price points on aRead More →

Chart patterns traders still watch in live markets

Introduction to Chart Patterns in Trading Chart patterns remain an essential tool in the modern trader’s arsenal, even as the market continuously evolves with the advent of new technologies and methodologies. These patterns, derived from historical data, serve as visual representations of price movements, which often occur in predictable manners. Over time, traders have come to rely on these patterns to anticipate potential price shifts and to strategize their trades effectively. This document delves into the significance of chart patterns, outlining key patterns, and explaining their usage within live markets. Why Chart Patterns Matter Chart patterns are more than just visual aids; they form anRead More →