2025-07-06
How to Spot Market Tops and Bottoms Using Technical Analysis
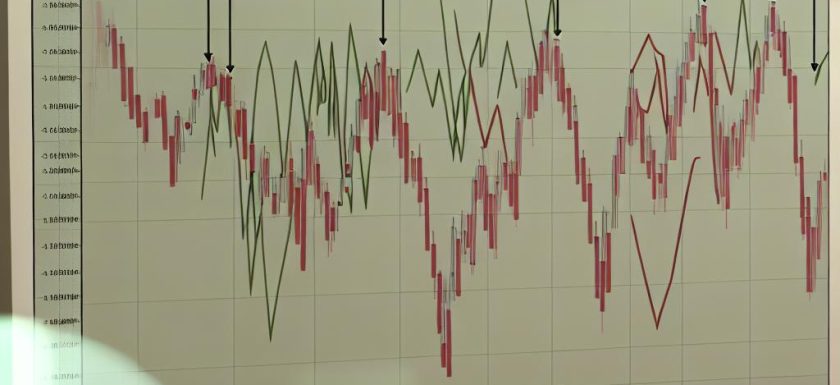
Understanding Market Tops and Bottoms In financial markets, understanding when to enter or exit trades is crucial for traders and investors seeking to optimize their returns and manage risk efficiently. Recognizing market tops and bottoms forms the cornerstone of successful trading strategies, enabling market participants to seize buy or sell opportunities. In essence, a market top represents a high-water mark before prices begin a downward trajectory, whereas a market bottom signifies the lowest point before an upward trend initiates. This article delves into various techniques used to identify these pivotal points, emphasizing the role of technical indicators and chart patterns in the process. Technical IndicatorsRead More →