Introduction to Chart Patterns in Trading
Chart patterns remain an essential tool in the modern trader’s arsenal, even as the market continuously evolves with the advent of new technologies and methodologies. These patterns, derived from historical data, serve as visual representations of price movements, which often occur in predictable manners. Over time, traders have come to rely on these patterns to anticipate potential price shifts and to strategize their trades effectively. This document delves into the significance of chart patterns, outlining key patterns, and explaining their usage within live markets.
Why Chart Patterns Matter
Chart patterns are more than just visual aids; they form an integral part of a trader’s toolkit by offering an analytical framework to understand market dynamics. For traders, the real utility of chart patterns lies in their ability to offer insights into market sentiment. By decoding these patterns, traders can foresee potential price breakouts and identify changes in market trends such as reversals or continuations.
The predictive quality of chart patterns aids traders in devising effective strategies. They provide critical information for setting entry and exit points in trading, enabling traders to maximize profits and minimize risks. The real strength of chart patterns is their ability to distill complex market movements into comprehensible signals.
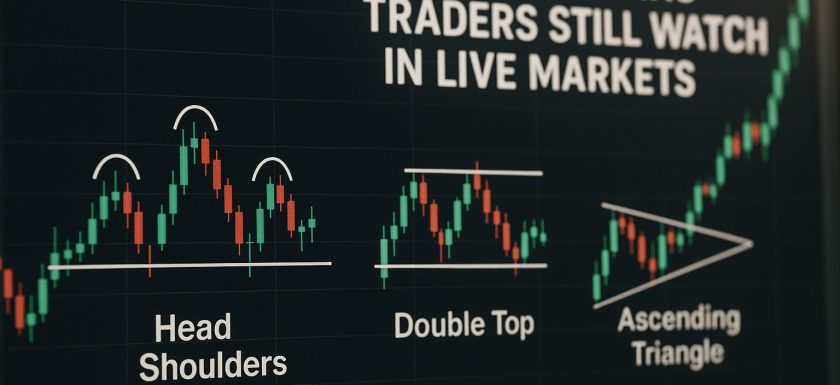
Classic Chart Patterns
Throughout the years, several chart patterns have consistently proven effective, demonstrating their reliability across various market conditions:
Head and Shoulders
The Head and Shoulders pattern is perhaps one of the most renowned among reversal patterns. Its structure, comprising three distinctive peaks—a higher peak (head) flanked by two smaller peaks (shoulders), offers a clear signal of an impending trend reversal. In a bullish market, this pattern suggests a reversal to a bearish trend, whereas in a bearish market, the inverse head and shoulders pattern can signal a move towards a bullish trend. Identifying this pattern accurately allows traders to adjust their positions in anticipation of the upcoming reversals.
Double Tops and Bottoms
Double Tops and Bottoms are also pivotal reversal patterns in technical analysis. A Double Top signifies a bearish reversal pattern, characterized by two distinct peaks of similar height. This indicates a forthcoming decline in price after a prolonged upward movement. Conversely, a Double Bottom, which features two troughs of comparable depth, signals a bullish reversal wherein prices are likely to climb following a downward trend. Recognition of these patterns aids traders in making timely decisions regarding exiting or entering trades.
Triangles
Triangles are classified as continuation patterns. They manifest when the price action is encapsulated within converging trendlines. There are three primary types: ascending, descending, and symmetrical. Ascending triangles are typically bullish continuation patterns, descending triangles signal bearish trends, and symmetrical triangles indicate uncertainty but generally suggest the continuation of the existing trend upon breakout. For traders, identifying these patterns means having the potential to predict the continuation of a prevailing market trend, thus facilitating strategic trading decisions.
Using Chart Patterns in Live Markets
While recognizing chart patterns forms the foundation of technical trading, effective usage requires a more holistic approach. Combining these patterns with other technical indicators allows traders to validate their interpretations. For example, volume analysis can support pattern predictions by confirming the validity of a breakout.
In practice, successful traders often merge pattern analysis with broader market insights to enhance decision-making. This involves monitoring economic indicators, geopolitical events, and other market dynamics that could affect price movements. Such comprehensive analysis positions traders to make informed choices, balancing the reliability of classic chart patterns with contemporary analytical methods.
Embracing technology in trading doesn’t negate the value of these patterns; instead, it enhances their utility. Tools that provide real-time data and analytic capabilities can be leveraged to discover patterns quicker and with greater accuracy. In this manner, chart patterns remain a timeless resource, assisting traders in navigating the intricacies of financial markets.
Challenges and Considerations
Despite the utility of chart patterns, it’s essential to acknowledge their limitations. Since these patterns are derived from historical price data, they inherently reflect past market conditions which may not always precisely predict future movements. Traders must remain cautious and avoid over-reliance without corroborating with other analytical means.
Moreover, patterns can occasionally present false signals. In such events, trades based on these patterns might not yield expected results. Correctly identifying patterns is thus crucial but requires experience and sometimes a degree of intuition. Traders must continually refine their skills and remain adaptable in their approach to different market scenarios.
Another consideration is the subjective nature of pattern recognition. What one trader interprets as a particular pattern might appear different to another. Thus, practice and experience are invaluable for honing the ability to identify and utilize these patterns reliably.
Conclusion
While financial markets continually evolve, chart patterns persist as foundational tools for traders worldwide. Their enduring relevance underscores the timeless nature of patterns in technical analysis. Mastery of chart patterns not only enhances a trader’s ability to predict market fluctuations but also builds a decisive edge in crafting strategic trades.
The capabilities offered by chart patterns, when combined with emerging tools and technologies, provide comprehensive insights that are invaluable regardless of market conditions. While new methodologies and tools will continue to emerge, the fundamental utility of chart patterns stands as a testament to their value, ensuring their place as an enduring aspect of successful trading strategies. Therefore, for traders at any level, familiarity with these patterns is not just beneficial; it’s a necessity for informed market participation.
This article was last updated on: April 10, 2026