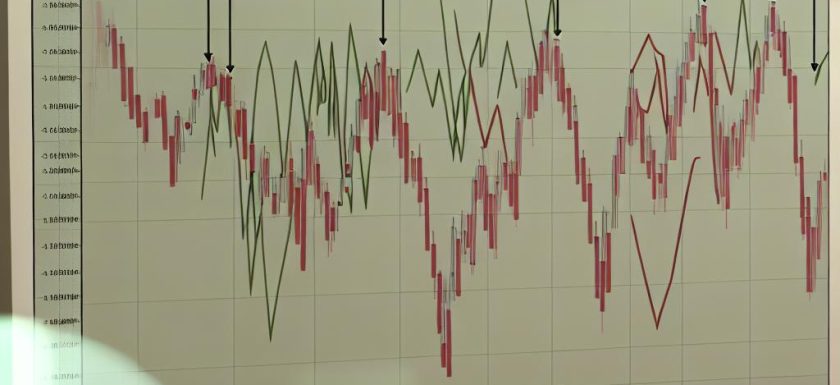
Understanding Market Cycles
Market cycles are a fundamental aspect of financial markets, representing the recurring phases of expansion and contraction. Identifying these cycles in index charts not only provides investors with valuable insights into potential investment opportunities and risks but also aids them in crafting well-informed strategic investment plans. By recognizing market cycles, investors can enhance their decision-making processes and potentially increase returns.
The Four Phases of Market Cycles
Within financial markets, market cycles typically consist of four distinct phases: expansion, peak, contraction, and trough. Each phase has unique characteristics and implications for market participants. Understanding these phases is crucial as it allows participants to anticipate possible changes in market dynamics and adjust their strategies accordingly.
Expansion
The expansion phase is characterized by growth within the markets. This growth is shown through rising stock prices and increasing investor confidence. Economic indicators tend to improve significantly during this phase. Typically, expansion coincides with robust corporate earnings, increased consumer spending, and favorable economic policies. Such conditions often provide fertile ground for new investments and encourage market participation.
Peak
Following expansion is the peak phase, marking the highest point of the market cycle. During this phase, market exuberance reaches its zenith. Valuations are often stretched, and prices may be driven more by investor sentiment than by underlying fundamentals. Indicators such as high price-to-earnings ratios and a slowdown in economic growth can signal an impending transition to the next phase. It is crucial for investors to remain vigilant during this phase, as opportunities for profit-taking may diminish swiftly if the market sentiment shifts.
Contraction
Contraction is the phase that follows the peak. It is characterized by declining market prices and reduced economic activity. During contraction, investor confidence tends to erode, leading to a withdrawal of investments. Economic conditions may worsen, resulting in lower corporate profits and tighter monetary policies. This phase is often accompanied by heightened volatility as the market adjusts to new economic realities. Understanding how to navigate contraction is vital for minimizing losses and identifying opportunities for eventual recovery.
Trough
The trough represents the lowest point in the market cycle, a period marked by depressed market values and low investor sentiment. Despite its challenges, the trough is also significant because it sets the stage for the next phase of expansion. Indicators suggesting a recovery may include improving economic data, policy support, and attractive valuations. Identifying the trough accurately can provide investors with early entry points for new investments as confidence begins to return to the market.
Analyzing Index Charts
For effective identification of market cycles, analyzing index charts for patterns and indicators is essential. Both technical and fundamental analyses play a significant role in this process.
Technical Analysis
Technical analysis involves the study of historical price charts to identify patterns and trends critical for understanding market direction.
Moving Averages: Moving averages help smooth out price data to highlight underlying trends. For instance, a bullish signal may be observed when a short-term moving average crosses above a long-term moving average, indicating potential growth.
Volume Analysis: Analyzing changes in trading volume provides insights into the strength of a trend. Increased volume during an upward price movement can signify a robust expansion phase, serving as a powerful confirmation tool.
Fundamental Analysis
Fundamental analysis involves an evaluation of economic indicators and financial metrics that impact market dynamics.
Economic Indicators: Factors like GDP growth rates, employment figures, and inflation data provide essential context for understanding the economic environment and assessing which market cycle phase is current.
Corporate Earnings: Monitoring corporate earnings alongside positive forward guidance can support the continuation of an expansion phase, reinforcing investor confidence and driving market sentiment.
Conclusion
Identifying market cycles within index charts requires a harmonious application of technical and fundamental analyses. By comprehending the phases of market cycles—expansion, peak, contraction, and trough—investors can refine their strategies to effectively manage risks and pursue opportunities. Continuous education and diligent monitoring of market trends and economic indicators are essential practices for accurately identifying market cycles and achieving investment success. Moreover, utilizing comprehensive financial analysis tools and platforms available online can further enhance one’s capability to analyze market cycles effectively.
This article was last updated on: June 22, 2025
