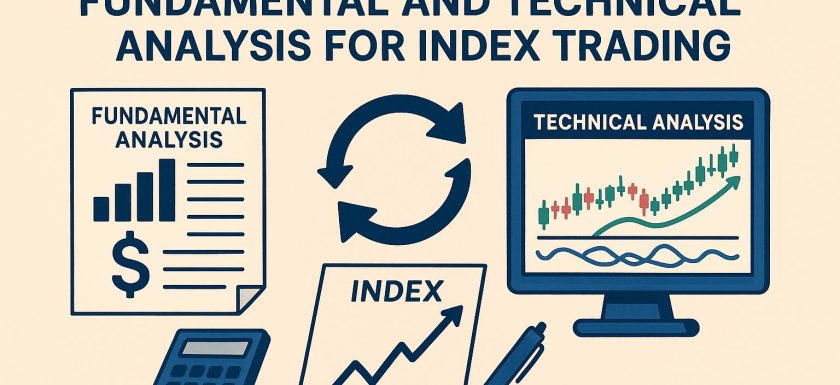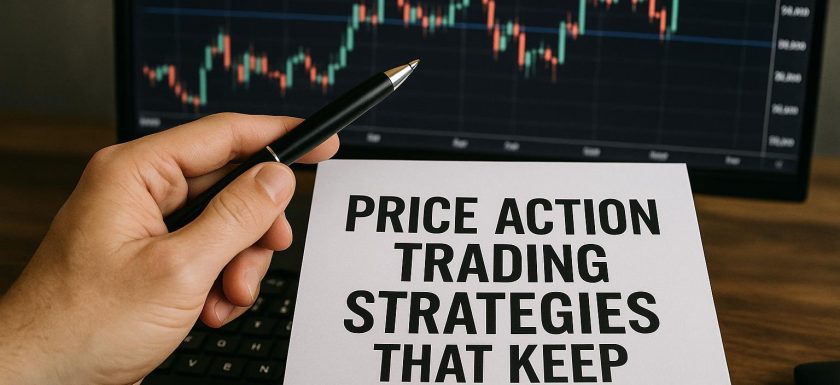
Price action trading strategies that keep charts clean
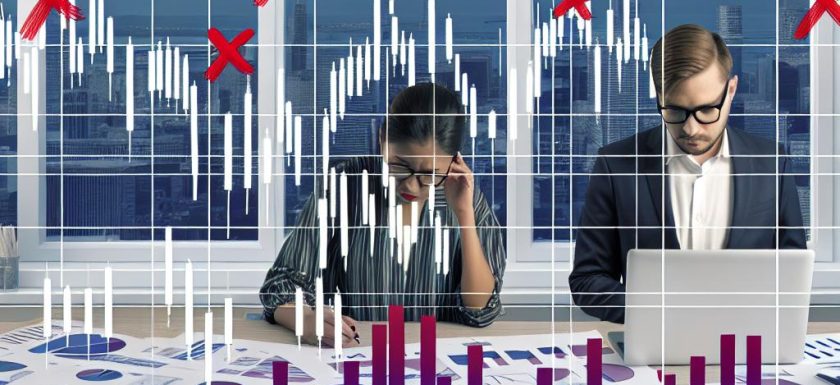
Understanding Price Action Trading Price action trading is a foundational technique utilized by many traders to interpret and act on market changes based on the actual price movements of financial assets rather than relying heavily on technical indicators. This approach emphasizes the analysis of historical and current price behaviors to better predict future market trends. By maintaining clear and minimally cluttered charts, traders can focus on significant price data, facilitating more informed decision-making processes. Why Keep Charts Clean? A clean chart is paramount for several reasons. Charts overloaded with numerous indicators can obscure the valuable price action signals traders are seeking. By removing superfluous indicators,Read More →