2025-09-04
Ichimoku Cloud Trading Strategy for Index Analysis
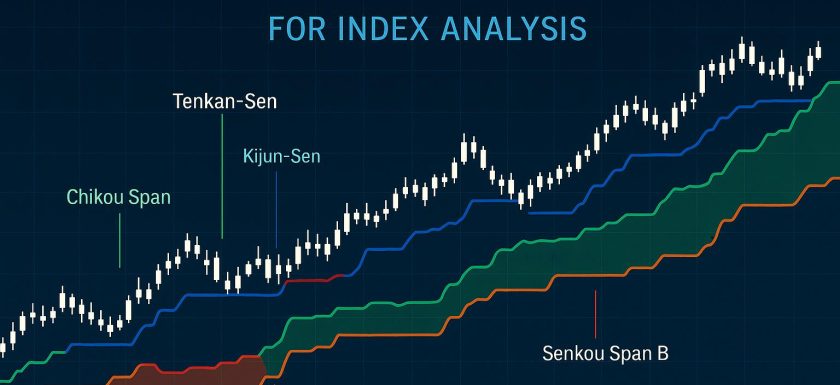
Overview of Ichimoku Cloud Trading Strategy The Ichimoku Cloud, developed by Goichi Hosoda during the late 1960s, offers a comprehensive approach to technical analysis, providing a holistic view of the markets. This system comprises several components that assist traders in identifying support and resistance levels, understanding trend direction, gauging momentum, and generating buy/sell signals. Its ability to present a clear visual depiction of market conditions has made it especially popular in index analysis. Components of the Ichimoku Cloud The Ichimoku Cloud, also known as Ichimoku Kinko Hyo, integrates five principal components: Tenkan-sen (Conversion Line): This is calculated as the midpoint of the last 9 periods’Read More →