Understanding Trend Lines in Technical Analysis
Trend lines serve as fundamental components in the realm of technical analysis, offering invaluable insights to traders and investors alike. These lines, simple in nature yet profound in their utility, provide a visual representation of market behavior. By illustrating the general direction and velocity of price movements, trend lines aid in making informed trading decisions. In this expanded discussion, we delve deeper into the methods of efficiently using trend lines while avoiding the pitfalls of cluttered charts.
Identifying Key Points
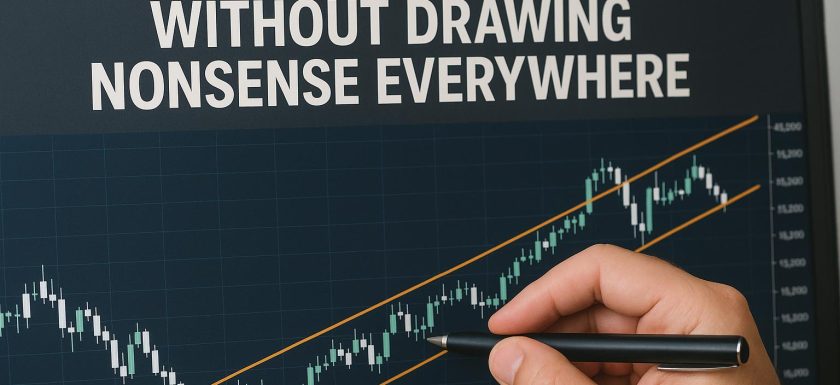
In technical analysis, the utility of trend lines stems from their ability to connect pivotal price points on a trading chart, thereby providing a coherent picture of the market’s trajectory. The process of drawing a reliable trend line begins with the identification of these critical points. To delineate an upward trend, it is essential to connect at least two successive lows. This demonstrates that buyers are active at increasingly higher prices, suggesting upward momentum. Conversely, for capturing a downward trend, connecting two or more successive highs is the rule. This indicates that selling pressure emerges at progressively lower prices, hinting at downward momentum. It is crucial that the points selected be significant and reflective of the broader market context to ensure that the trend line accurately mirrors the prevailing market trends.
Maintaining Consistency
One of the most important principles in technical analysis is consistency, especially when constructing trend lines. It is vital that all trend lines are drawn using comparable scales and time frames. Consistency in this area ensures that the analysis remains relevant and meaningful. For instance, employing a combination of daily, weekly, and monthly charts without consistent scaling can lead to discrepancies in the perception of trends. Should a trend line deviate from the established pattern of price movements, it may be necessary to revisit and potentially modify your chosen anchor points. This reevaluation should occur before attempting to adjust the line to force a fit, as such adjustments could lead to inaccurate analyses and potentially misguided trading decisions.
Avoiding Overfitting
Overfitting is a common pitfall in trend line analysis and should be avoided to maintain clarity and accuracy. This error occurs when trend lines are excessively convoluted or are manipulated to correspond with every minor fluctuation in price. Such practices result in charts that are cluttered and difficult to interpret, often leading to misguided analysis. To maintain clarity, it is advisable to focus on drawing trend lines that capture the predominant and clearly discernible trends based on the key points previously identified. This approach ensures that trend lines remain a practical tool for analysis rather than an added complexity.
Confirming Validity
The confirmation of a trend line’s validity is a crucial aspect of technical analysis. A reliable trend line is characterized by the repeated testing and acknowledgment of an asset’s prices. If prices tend to rebound consistently upon approaching the trend line, it reinforces the line’s validity, effectively acting as a support or resistance level. Nonetheless, it is important to remain cautious, as no trend line is infallible, and market trends can and do change direction. To bolster trend line analysis, it is recommended to combine these tools with other technical indicators. Such a comprehensive approach can provide a more robust analysis of market conditions, enabling traders to recognize potential shifts before they occur.
Using Trend Lines as Part of a Strategy
While seemingly elementary, trend lines can be extraordinarily effective when integrated into a wider and more intricate analytical strategy. To optimize their utility, traders should consider incorporating trend lines with other technical indicators such as moving averages or momentum indicators. These complementary tools can enhance the effectiveness of trend lines, providing a more nuanced view of market tendencies.
Implementing such layered strategies necessitates a commitment to continuous learning and adaptation. By engaging in back-testing strategies across varied market conditions, traders can ascertain the strengths and limitations of their chosen methodologies. This practice not only enhances confidence in employing trend lines but also aids in refining strategies for better future outcomes.
Furthermore, to complement this foundational understanding, additional resources like Investopedia offer comprehensive guides on trend lines and technical analysis, proving beneficial for those seeking to expand their trading acumen.
By adhering to these outlined guidelines, market participants can adeptly integrate trend lines into their analytical practice, facilitating clearer and more impactful insights. Consequently, this approach leads to more precise and actionable trading decisions devoid of the distractions caused by cluttered and over-analyzed charts. Whether employed in isolation or as part of a more comprehensive toolkit of technical indicators, trend lines remain an indispensable element for traders aiming to navigate the complexities of modern financial markets with competence and clarity.
This article was last updated on: April 17, 2026