
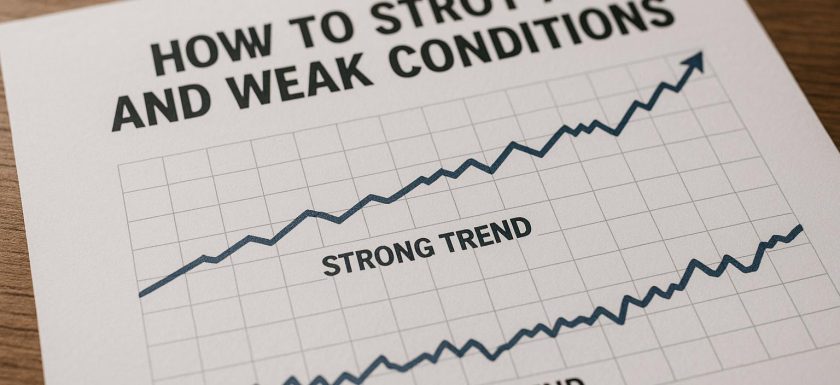
How to spot strong and weak trend conditions

Understanding Trend Conditions in Financial Markets In the ever-evolving landscape of financial markets, one of the critical competencies for traders and investors is the ability to discern trend conditions. Whether you are trading stocks, futures, currencies, or any other financial instruments, understanding trends is essential to making informed decisions. Trends represent the general direction of the price movement within the markets, and identifying these trends can significantly influence trading and investment strategies. This discussion will explore the features that define both strong and weak trend conditions and how these can be leveraged to enhance trading effectiveness. Characteristics of Strong Trend Conditions A market is saidRead More →

How to use multi time frame analysis without confusing yourself

Understanding Multi Time Frame Analysis Multi time frame analysis is a technique utilized by traders to gain a comprehensive perspective of the market by examining the same asset over various time frames. This method not only aids in identifying trends but also in pinpointing potential entry points and possible reversals, offering greater clarity in market conditions. By conducting analysis across different time frames, traders are empowered to make more informed decisions, reducing the chances of overlooking crucial market signals that could impact their trading strategy. Choosing the Right Time Frames Selecting the appropriate time frames is a crucial aspect of multi time frame analysis. ItRead More →

Why too many indicators make technical analysis worse

Understanding the Pitfalls of Overloading on Indicators in Technical Analysis Technical analysis serves as a foundational strategy for traders looking to forecast the potential movements of financial markets. This approach deeply focuses on the examination of historical market data, especially price and volume, to discern discernible patterns that inform investment decisions. Indicators, when adeptly integrated into this process, can significantly bolster a trader’s analytical framework. However, the temptation to overuse these tools can lead to counterproductive outcomes, hampering the efficacy of technical analysis. The Nature of Technical Indicators Technical indicators are mathematical derivatives of historical market inputs such as price, volume, and open interest. TheseRead More →

How to simplify a cluttered technical analysis chart

Simplifying a Cluttered Technical Analysis Chart Technical analysis charts serve as a vital tool for traders worldwide, offering insights into market movements and assisting in making informed decisions. However, these charts often morph into a visual maze due to the excessive use of indicators, patterns, and lines. This clutter is not only overwhelming but can significantly hinder effective interpretation and decision-making. Therefore, simplifying these technical analysis charts is crucial for accurate analysis and sound trading strategies. Let us delve into some structured methods to untangle a cluttered chart and use it effectively for trading purposes. Limit the Number of Indicators One primary step toward simplifyingRead More →

How to read market rhythm instead of forcing indicators

Understanding Market Rhythm To effectively trade and make informed decisions, one must understand the concept of market rhythm. Grasping the natural flow and movement of the market without solely relying on indicators that might sometimes be misleading can yield better insights. Market rhythm refers to the patterns and fluctuations inherent in financial markets, driven by various factors including economic data, investor sentiment, and geopolitical events. Observing Market Trends Identifying market trends is crucial for understanding market rhythm. Trends typically follow three main directions: upward, downward, or sideways. Recognizing these patterns allows traders to gain insights into potential future movements. A careful observation of the market’sRead More →