
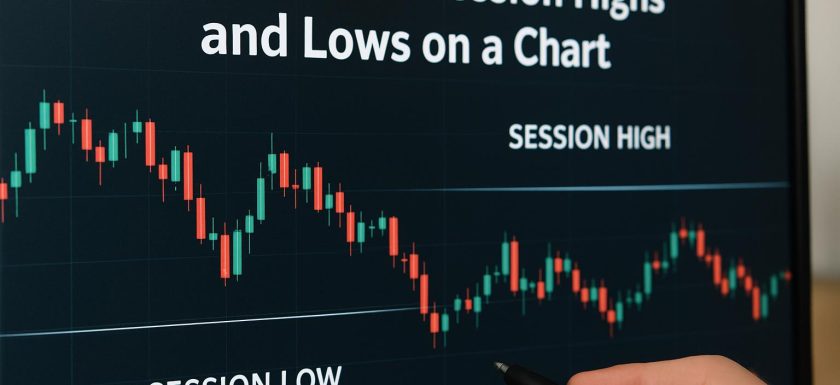
How to use session highs and lows on a chart

Understanding Session Highs and Lows Session highs and lows are significant reference points on financial charts, providing insights into market momentum and potential support and resistance levels. In trading, a session typically refers to the period from the market’s opening to its closing on a specific day. The high is the peak price reached during the session, while the low is the lowest price. This foundational concept is pivotal for traders who aim to gain an edge in understanding how a market behaves throughout the course of a trading session. Importance of Session Highs and Lows Session highs and lows assist traders in understanding marketRead More →
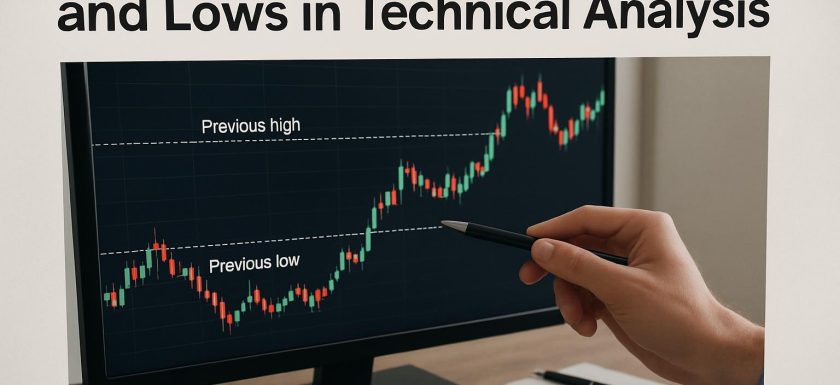
How to use previous highs and lows in technical analysis

Understanding Previous Highs and Lows in Technical Analysis Technical analysis involves evaluating financial markets based on historical price data and statistical indicators. By examining past price behaviors, traders can make more informed decisions about future market movements. One fundamental aspect of this approach is the analysis of previous highs and lows, which can provide insights into market trends and potential future movements. Previous Highs In technical analysis, a previous high refers to the maximum price level that an asset has reached during a specific timeframe, such as a day, week, or month. Analyzing these highs is crucial for several reasons: Identify Resistance Levels: Previous highsRead More →

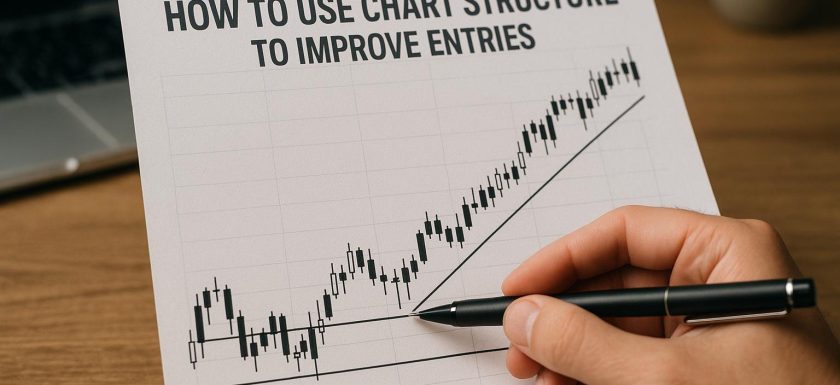
How to use chart structure to improve entries

Understanding Chart Structures Chart structures are indispensable tools for traders and investors when it comes to making informed entry decisions in the financial markets. A chart structure essentially refers to the arrangement and pattern of price movements over time, typically represented by candlestick charts, bar charts, or line charts. These structures form the backbone of technical analysis, offering valuable insights into potential future price movements. Types of Chart Patterns In the vast realm of technical analysis, chart patterns play a crucial role as visual representations of historical price movements. By understanding these patterns, traders can make educated predictions about future price directions. Chart patterns canRead More →

How to identify choppy conditions before taking a trade

Understanding Choppy Market Conditions In the world of trading, one often encounters various market conditions that can influence decision-making processes. Among these is the phenomenon known as a choppy market, which is characterized by indecisive price movements, lacking a clear upward or downward trend. Such conditions present unique challenges and can be particularly frustrating for traders, especially those who rely on clear directional movement to capitalize on price fluctuations. Recognizing choppy market conditions before committing to a trade becomes crucial to managing risks and avoiding potential losses. Key Indicators of Choppy Conditions Identifying choppy market conditions demands a keen observation of several key indicators. TheseRead More →