How to spot compression before a bigger move

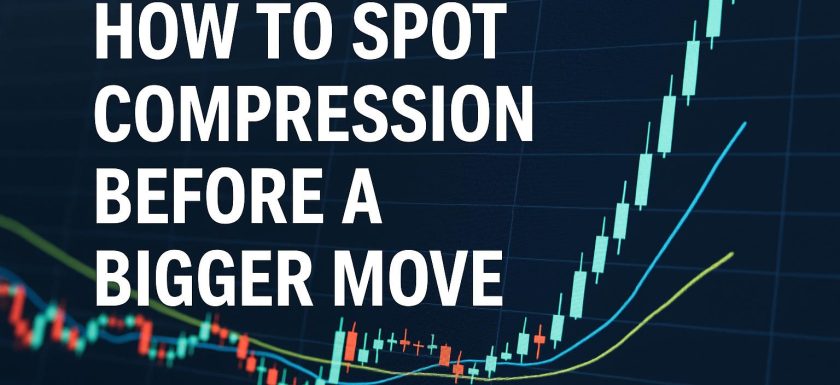
Understanding Compression in Financial Markets Compression in financial markets refers to periods of low volatility when the price of an asset moves in a tight range. Often, this phase serves as a precursor to a significant price movement, either upward or downward. Recognizing compression can provide traders with an opportunity to prepare for forthcoming volatility and adjust their trading strategies accordingly. Identifying Compression Patterns Compression is generally visible in the form of chart patterns. Traders commonly look for patterns such as triangles, rectangles, and flags which signal potential price consolidation. These patterns often indicate a balance of power between buyers and sellers, leading to aRead More →

How to use channels in technical analysis

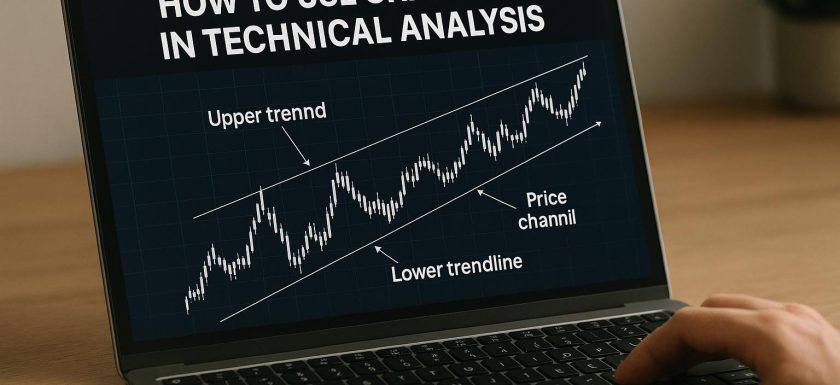
Understanding Channels in Technical Analysis Technical analysis is a crucial part of understanding market trends and making informed trading decisions. One of the tools used by traders in this analysis is channels. Channels are essentially tools that help identify a trend direction and possible price targets. They are depicted by drawing two parallel lines around a price trend. In this expanded exploration, we will delve deeper into the concept of channels and their applications in technical analysis to provide traders with a comprehensive understanding of how to effectively utilize this tool. Types of Channels Channels can be powerful guides for traders seeking to capitalize onRead More →

How to trade around round numbers using technical analysis

Understanding Round Numbers in Trading In the realm of financial markets, round numbers such as 100, 1000, or even 10,000 often serve as psychological barriers. These numbers are not arbitrary; they carry a psychological weight among traders and investors. It’s crucial to understand that these numbers can significantly influence trading behaviors and market dynamics. The Psychological Impact of Round Numbers Round numbers are easily remembered and are psychologically satisfying targets for traders. This phenomenon, sometimes referred to as “price clustering,” occurs when traders place buy or sell orders around these numbers. As a result, round numbers often represent areas of significant price resistance or support.Read More →

How to read price rejection at important levels

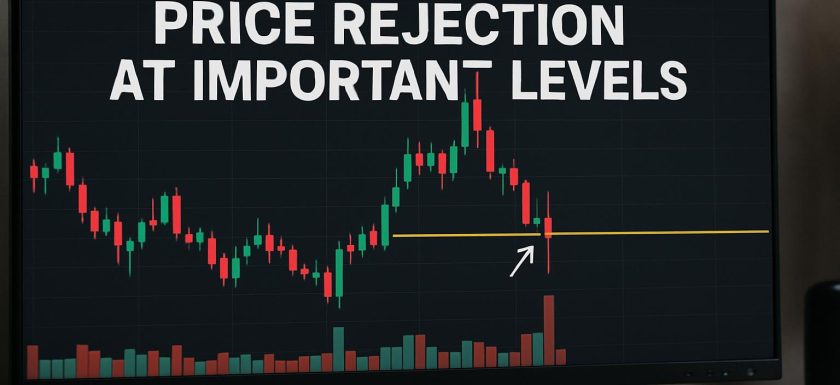
Understanding Price Rejection at Important Levels In the dynamic world of trading, comprehending how to interpret price rejection at significant levels is an invaluable skill. Price rejection often acts as an indicator of potential reversals or continuations within market trends, making it imperative for traders to recognize and interpret these signals appropriately. What is Price Rejection? Price rejection occurs when the price of an asset approaches a pivotal level but fails to sustain momentum past that point. This phenomenon can appear in various forms, such as specific candlestick patterns or swift reversals. Essentially, the rejection signals that there was inadequate buying or selling pressure toRead More →