Understanding Previous Highs and Lows in Technical Analysis
Technical analysis involves evaluating financial markets based on historical price data and statistical indicators. By examining past price behaviors, traders can make more informed decisions about future market movements. One fundamental aspect of this approach is the analysis of previous highs and lows, which can provide insights into market trends and potential future movements.
Previous Highs
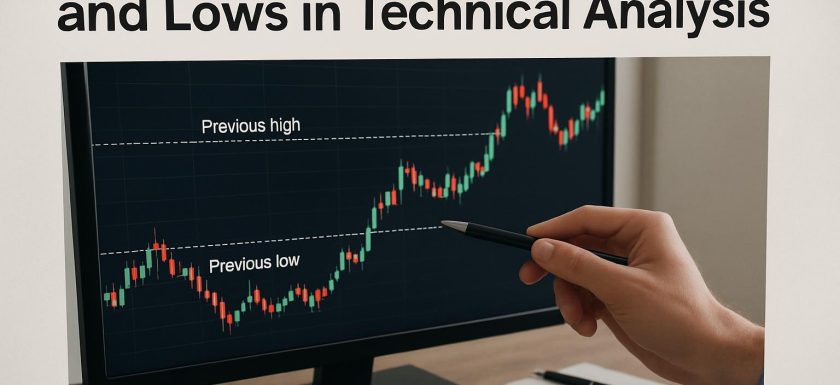
In technical analysis, a previous high refers to the maximum price level that an asset has reached during a specific timeframe, such as a day, week, or month. Analyzing these highs is crucial for several reasons:
Identify Resistance Levels: Previous highs often serve as resistance levels in technical analysis. These are points where selling pressure typically outweighs buying pressure, impeding the price from increasing further. Resistance levels can be crucial in identifying potential price reversals or periods of consolidation. Traders monitor these levels to anticipate and prepare for movements that could signify such a reversal or consolidation, allowing them to adjust their strategies accordingly.
Detect Breakouts: When the price successfully moves above a previous high, it indicates a market breakout. This suggests a strong upward trend, as the resistance level has been surpassed. Such breakouts are crucial moments in market analysis, as they can signal a shift in market dynamics. Traders often view these breakouts as opportunities to initiate new positions, expecting that the momentum will carry the price even higher.
Previous Lows
Conversely, a previous low represents the lowest price an asset has reached within a specific period. These lows are just as significant as highs, providing important information for market analysis:
Identify Support Levels: Just as resistance levels can cap price increases, support levels can prevent declines. Previous lows often function as support levels, representing a point where buying interest overcomes selling pressure. Traders use previous lows to establish points where the price might find support. Understanding where these levels lie allows traders to make strategic decisions about entering or exiting positions during a downturn, expecting that the price may rebound.
Gauge Market Sentiment: The movement relative to previous lows can also offer valuable insights into market sentiment. Sustained trading below a previous low often suggests bearish sentiment, as it indicates that the price is not finding support at traditionally strong levels. Conversely, the inability to breach a previous low might indicate market strength, suggesting buyer confidence. Monitoring these levels helps traders gauge the overall market sentiment and adapt their strategies accordingly.
Incorporating Highs and Lows into Trading Strategies
To utilize previous highs and lows effectively, traders often combine them with other technical indicators, such as moving averages or the Relative Strength Index (RSI). The integration of these tools can lead to a more comprehensive understanding of market dynamics.
For instance, moving averages can help smooth out price data and highlight trends, making it easier to identify when prices are near significant highs or lows. Similarly, the RSI can identify overbought or oversold conditions, providing additional context when considering the implications of recent highs and lows.
By combining these indicators with a keen understanding of previous highs and lows, traders can formulate more effective strategies and improve their trading decisions. This integrated approach allows traders to capitalize on potential market shifts, such as breakouts or reversals, by aligning them with broader market trends.
For individuals looking to deepen their understanding of how to integrate these tools into a trading plan, a wealth of resources is available online. Platforms like Investopedia offer in-depth guides and educational materials designed to enhance one’s grasp of technical analysis and its applications in real-world trading scenarios.
The Importance of Context
While analyzing previous highs and lows provides valuable insights into market behavior, context remains essential in making accurate and profitable trades. Market conditions are influenced by a myriad of factors beyond historical price patterns. News events, economic indicators, geopolitical tensions, and other external events often have significant impacts on market sentiment and price movements.
Traders should bear these factors in mind to improve their analyses. For instance, a breakout above a previous high during a period of positive market sentiment might have different implications than a similar movement in a more volatile or uncertain environment. Being aware of these broader market dynamics can help traders interpret highs and lows more accurately and make better trading decisions.
Furthermore, combining technical analysis with fundamental analysis can provide a more rounded view of market conditions. This approach allows traders not only to understand past price movements but also to anticipate how current and future events might influence prices, thereby improving the likelihood of successful trades.
Conclusion
In summary, previous highs and lows are vital components of technical analysis that offer valuable insights into market behavior. By identifying these key levels, traders can anticipate potential price movements and make more informed trading decisions. However, it is important to remember that technical indicators, including highs and lows, should be used in conjunction with other analysis tools and a keen awareness of market context. Such a comprehensive approach maximizes their utility and enhances the trader’s ability to navigate the complexities of financial markets successfully. This method ensures that decisions are not made in isolation but are instead part of a larger strategic plan accounting for various market influences and dynamics.
This article was last updated on: June 25, 2026