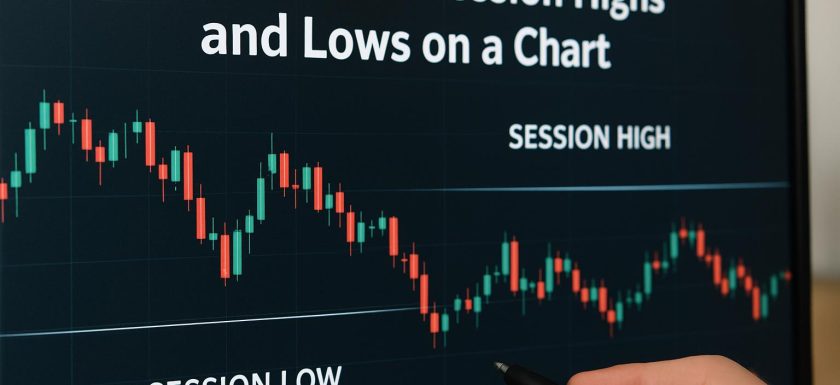
Understanding Session Highs and Lows
Session highs and lows are significant reference points on financial charts, providing insights into market momentum and potential support and resistance levels. In trading, a session typically refers to the period from the market’s opening to its closing on a specific day. The high is the peak price reached during the session, while the low is the lowest price. This foundational concept is pivotal for traders who aim to gain an edge in understanding how a market behaves throughout the course of a trading session.
Importance of Session Highs and Lows
Session highs and lows assist traders in understanding market dynamics, enabling them to make informed decisions. These levels are essential in identifying trends, reversals, and potential entry and exit points for trades. Understanding how to interpret and use these points can enrich a trader’s strategy significantly, offering a framework upon which further analysis can be constructed.
Support and Resistance Levels
Session highs and lows frequently act as natural support and resistance levels. A session high that remains unbroken throughout the day might indicate a strong resistance level. Conversely, a session low that holds could serve as a support level. Traders pay close attention to price reactions at these points to determine if the market will respect or break through these levels. By understanding these support and resistance levels, traders can potentially anticipate where future price barriers may exist, which is crucial for timing their trades effectively.
Trend Identification
Tracking the progression of session highs and lows can also help to identify market trends. If a market is consistently setting higher highs and higher lows, it indicates an uptrend, driven by bullish sentiment that could be due to positive economic data, favorable news, or strong earnings reports. On the other hand, an ongoing development of lower highs and lower lows suggests a downtrend, often triggered by bearish news, market uncertainty, or poor economic indicators. Recognizing these patterns can provide valuable insights into the market direction, allowing traders to align their strategies with the prevailing market sentiment.
Utilizing Session Highs and Lows in Trading
Incorporating session highs and lows into your trading strategy involves monitoring these levels alongside other technical indicators. For example, combining these points with moving averages, Bollinger Bands, or oscillators such as the Relative Strength Index can enhance the accuracy of market analysis. Traders often wait for confirmation signals, such as increased trading volume or alignment with trendlines, before acting on breakouts or reversals at these levels, which minimizes the risk of false signals.
Breakouts and Fakeouts
A breakout occurs when the price moves above a session high or below a session low, potentially signaling the continuation of a trend. This breakout could be fueled by high trading volumes, positive news, or other market-driving factors. However, traders need to remain vigilant for fakeouts, situations where the price breaches these levels temporarily but then reverses, trapping traders in unfavorable positions. Waiting for confirmation, such as sustained price movement or corroborative indicators, is essential to authenticate a breakout and avoid being caught in false movements that do not follow through.
Setting Stop-Loss and Take-Profit Levels
Session highs and lows can also provide guidance in setting stop-loss and take-profit levels. By placing stop-loss orders just beyond session highs or lows, traders can limit potential losses while simultaneously ensuring that trades have room to develop naturally. Similarly, take-profit orders set relative to these levels can help secure gains when the market moves favorably. This method leverages natural market barriers, aiming to optimize risk management and the probability of successful trades. Adjusting these levels dynamically in response to evolving market conditions can also play a role in a comprehensive risk management strategy.
Contextualizing with Other Market Factors
In addition to using session highs and lows independently, contextual factors such as economic data releases, geopolitical events, and central bank announcements can significantly influence market movements. Traders should incorporate the potential impacts of these events into their analysis of session highs and lows. Understanding how these external factors might affect price levels allows traders to better anticipate market reactions and align their strategies accordingly. This informed approach can thus provide a broader picture of market dynamics, potentially leading to more successful trading outcomes.
Conclusion
Session highs and lows serve as vital tools for traders seeking to understand market behavior and improve decision-making. By combining analysis of these levels with other analytical tools, such as volume indicators, candlestick patterns, and momentum oscillators, traders can strengthen their strategies and navigate the complexities of the trading environment effectively. Understanding the nuances of session highs and lows requires practice and patience, but these efforts can lead to more informed and confident trading decisions. For further reading on trading strategies and the effective use of market data, exploring resources from trading educators or financial analytics firms can provide deeper insights and advanced techniques.
This article was last updated on: June 26, 2026