
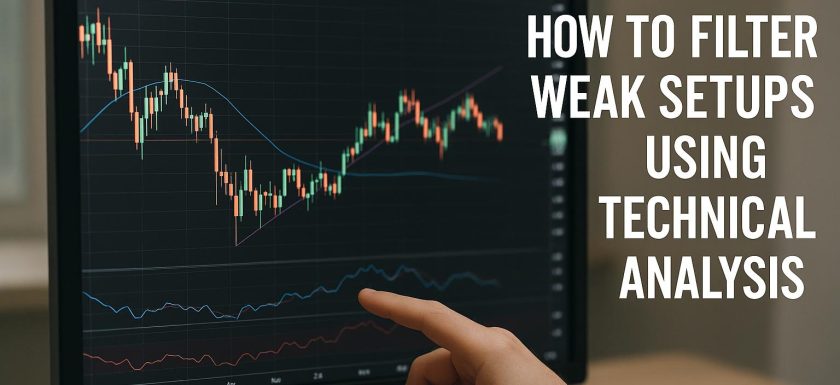
Filtering Weak Setups Using Technical Analysis
Technical analysis is an indispensable tool for traders who aim to make well-informed decisions in the financial markets. While technical analysis can provide valuable insights, not every setup identified through this approach is strong or reliable. Filtering out weak setups becomes crucial for those looking to improve their trading performance and reduce the likelihood of potential losses. This discussion will elaborate on this concept and explore various aspects that traders should consider when conducting technical analyses.
Understanding Technical Indicators
Before delving into the intricacies of filtering, it is essential to grasp the role of technical indicators in trading. These indicators are mathematical calculations derived from historical price data and volume, assisting traders in identifying market trends and potential entry and exit points. Some of the most widely-used technical indicators include Moving Averages, Relative Strength Index (RSI), and the Moving Average Convergence Divergence (MACD). Each of these indicators serves a specific purpose and can offer unique insights into the market conditions.
Moving Averages help smooth price data to identify the direction of the trend. They can be simple, based on arithmetic means over a certain period, or exponential, which gives more weight to recent prices. Understanding Moving Averages can help traders make decisions based on the overall trend.
Relative Strength Index (RSI) is a momentum oscillator that measures the speed and change of price movements. It ranges from 0 to 100 and is typically used to identify overbought or oversold conditions. An RSI of above 70 might indicate an overbought condition, which could signal a potential downward correction.
The MACD indicator is used to identify changes in the strength, direction, momentum, and duration of a trend in a stock’s price. It consists of two components: the MACD line and the signal line. Crossovers of these lines can indicate entry or exit points.
Identifying Weak Setups
Weak setups can be characterized by specific features that traders must be able to identify. Recognizing these can aid in avoiding potential losses associated with unreliable trades.
Poor Alignment with Trend
A setup that does not align with the prevailing market trend is often deemed weak. When a trader attempts to initiate a buy position during a distinct downtrend, the risk is inherently higher. Utilizing trend indicators such as moving averages can assist in determining the market’s overall direction, thereby avoiding decisions that might go against a strong trend.
Overextended Indicators
Market indicators like RSI or Stochastic Oscillator can occasionally become overextended, suggesting imminent reversals or corrections. An RSI value above 70 might signify an overbought condition, while a value below 30 implies an oversold scenario. Trading against these signals without ample confirming evidence can lead to weak setups. Awareness of these overextensions is crucial for preventing premature or uninformed trades.
Volume Analysis
Another critical component of filtering setups is the analysis of trading volume. Trading volume offers deep insights into the robustness of a particular setup. A strong setup is frequently marked by a notable surge in trading volume, indicating robust market engagement. On the flipside, signals of potential breakouts or reversals that come with low trading volume might imply a lack of widespread conviction, hinting toward a weak setup. It is imperative to assess volume alongside other indicators to gauge the true strength of a setup.
Divergences between Price and Indicators
One must also consider divergences between price action and indicator movement. Divergences occur when the movement of an indicator diverges from the price actions. It could be an indication of a weakening trend. For instance, if the price continues its upward trajectory but the RSI shows a declining trend, it could signify a weakening bullish setup, meriting a cautious approach.
Role of Support and Resistance Levels
Support and resistance levels play an instrumental role in determining the reliability of a setup. A setup that emerges near a significant support or resistance level sometimes holds greater reliability than those in less defined areas, which might be indicative of weak setups. Monitoring how prices react at these levels assists traders in making better-informed decisions. The price bouncing off a support or resistance level, rather than breaking through, should inform a trader of potential price direction.
Utilizing Multiple Time Frames
For a more nuanced understanding of a setup’s robustness, examining multiple time frames is indispensable. A setup might seem promising on a shorter time frame but may lose its appeal when viewed over a longer period. Cross-referencing signals across different time frames can help identify potential contradictions, thereby aiding in the filtering out of weaker setups. For instance, if a buy signal appears on an hourly chart but contradicts the daily trend, it might warrant careful consideration.
Incorporating Historical Data in Analysis
Historical data can provide traders with a background context that enhances decision-making. Examining past price trends, previous instances of indicators reaching similar levels, and historical reactions at specific support or resistance levels can all lend insight into the current setup’s potential. By factoring in historical data, traders can often discern patterns that can inform the filtering of weak setups.
Conclusion
Effectively filtering weak setups using technical analysis is a vital skill for traders seeking to minimize risk and make calculated decisions. By gaining a comprehensive understanding of indicators, evaluating trading volume, assessing prevailing market trends, and employing multiple time frames along with historical data, traders can significantly enhance their capability to differentiate between strong and weak setups. Achieving this discernment is essential for making more informed trading choices and fostering better long-term trading outcomes.
This article was last updated on: October 9, 2026