
How to analyse chart structure before the market opens

Understanding Pre-Market Chart Analysis Prior to the market opening, one of the crucial tasks for traders is to conduct an analysis of chart structures. This pre-market chart analysis is essential for them to make informed decisions, interpret price movements accurately, and prepare for different market scenarios that may unfold throughout the trading day. The Importance of Analyzing Chart Structures Charts are indispensable tools for traders as they provide a visual representation of price movements over a specific period. By delving into these structures, traders can identify trends, detect patterns, and foresee potential reversals. Acquiring this understanding is pivotal in the development of robust trading strategies,Read More →

How to compare clean charts and messy charts

Understanding Clean vs. Messy Charts In the realm of data visualization, using charts to present data plays a crucial role in effectively conveying information. The distinction between clean and messy charts can significantly impact an audience’s ability to interpret and make sense of the data being presented. Understanding the attributes that define clean and messy charts is essential to enhance data communication and ensure the clear transmission of information. Characteristics of Clean Charts Clean charts are meticulously designed to provide insights that are clear and easily understandable. They stand out due to several distinct features which contribute to their effectiveness: Simplicity: Clean charts are oftenRead More →

How to build a repeatable chart reading routine

Understanding the Importance of a Repeatable Chart Reading Routine Developing a repeatable chart reading routine is crucial for anyone engaged in technical analysis, primarily for trading or analytical purposes. Such a routine is paramount because it establishes consistency and accuracy within one’s trading strategy, which, in turn, reduces emotional bias. By emphasizing a systematic approach, traders and analysts enhance their decision-making processes significantly by relying on data-driven insights rather than subjective interpretations. Essential Components of a Chart Reading Routine Building a robust chart reading routine involves integrating several key components consistently. Each component plays a vital role in providing a comprehensive understanding of market dynamics.Read More →

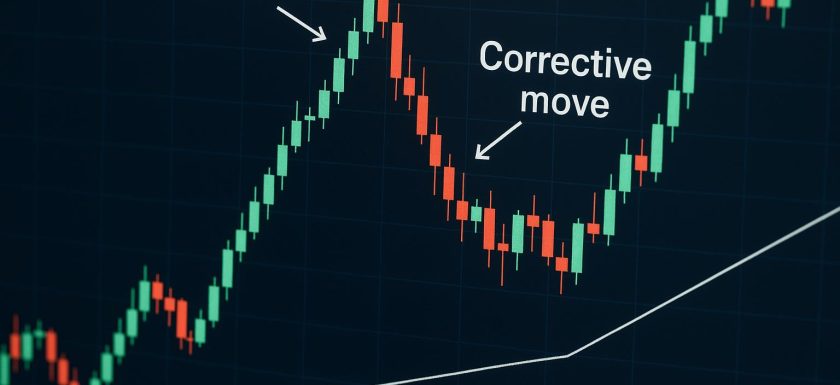
How to read impulsive and corrective moves on a chart

Understanding Impulsive and Corrective Moves In the landscape of trading and technical analysis, the essence of price movements becomes a pivotal aspect in predicting market trends effectively. Two predominant types of moves that traders and analysts frequently observe on price charts are impulsive and corrective moves. These terms encapsulate the distinct phases of price movement within a prevailing trend, elucidating various dimensions of market dynamics. Impulsive Moves Impulsive moves, alternatively referred to as impulse waves, signify robust and forceful price movements aligned with the predominant trend. Typically, these moves manifest through elongated candles or bars, accompanied by substantial price shifts. Factors such as favorable marketRead More →