
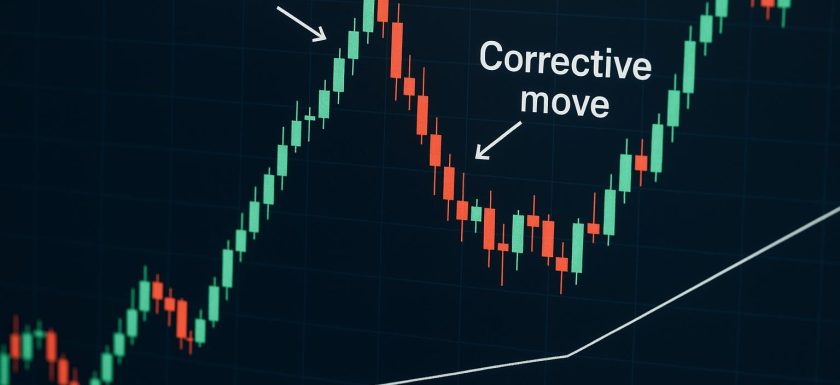
Understanding Impulsive and Corrective Moves
In the landscape of trading and technical analysis, the essence of price movements becomes a pivotal aspect in predicting market trends effectively. Two predominant types of moves that traders and analysts frequently observe on price charts are impulsive and corrective moves. These terms encapsulate the distinct phases of price movement within a prevailing trend, elucidating various dimensions of market dynamics.
Impulsive Moves
Impulsive moves, alternatively referred to as impulse waves, signify robust and forceful price movements aligned with the predominant trend. Typically, these moves manifest through elongated candles or bars, accompanied by substantial price shifts. Factors such as favorable market sentiment, impactful economic news releases, or notable shifts in supply and demand dynamics often drive these movements.
Recognizing an impulsive move involves identifying at least five waves that align with the main trend, following principles from the Elliott Wave Theory. For granular analysis, traders can dissect these waves into smaller timeframes to gain more detailed insights into market behavior. Key attributes of impulsive moves include a higher degree of volatility, escalated trading volume, and a pronounced directional bias.
In conducting technical analysis, impulsive moves serve as markers of strength in a market. Their presence can be indicative of significant breakouts or trend continuations, often drawing the attention of traders who specialize in trend-following methodologies. Trading strategies anchored in momentum or trend-following principles consider these moves to reinforce positions aligning with the market’s trajectory.
Corrective Moves
On the contrary, corrective moves, or corrective waves, represent phases of consolidation or retracement succeeding impulsive moves. Typically weaker in nature, these movements travel against the primary trend, serving as temporary pauses before the prevailing trend regains momentum. Corrective moves assist traders in evaluating the robustness of a trend, usually featuring smaller scales and shorter candles or bars.
Falling under the purview of the Elliott Wave framework, corrective moves are likely to consist of three waves, designated as Waves A, B, and C. Unlike their impulsive counterparts, corrective moves often exhibit subdued volume levels and embody sideways trading patterns, reflecting market indecisiveness or a lack of strong drivers.
In the context of trading, recognizing corrective moves is pivotal for strategists seeking to optimize trade entries and exits. These moves are instrumental in identifying potential reversals or retracement points, particularly favored by short-term traders. Moreover, corrective moves offer opportunities to gauge market strength by observing the extent and nature of price consolidation.
Applications in Trading
Harnessing the knowledge of impulsive and corrective moves proves indispensable for traders intent on refining their entry and exit strategies. Impulsive moves may presage potential breakouts or trend continuations, rendering them attractive prospects for trend-following or momentum-based strategies. Conversely, corrective moves present occasions for short-term traders to identify reversal points or retracement levels.
To further enhance the analysis of corrective moves, traders can employ various technical tools, such as Fibonacci retracement levels. Such tools aid in pinpointing potential support and resistance zones within market corrections, enabling traders to strategize accordingly. By integrating these insights into their trading strategies, traders can align their tactics with prevailing market conditions.
Furthermore, understanding the nuances of impulsive and corrective moves equips traders with the ability to anticipate market shifts more effectively. These insights contribute to constructing well-informed trading strategies, improving the chances of successful outcomes aligned with the broader market dynamics.
Conclusion
Comprehension of the distinction between impulsive and corrective moves constitutes a fundamental aspect of technical analysis, facilitating the construction of potent trading strategies. The capability to discern and interpret these moves on price charts empowers traders, enhancing their decision-making process by aligning strategies with the market’s underlying dynamics. For those seeking to delve deeper into trading strategies or chart analysis, valuable resources such as Investing.com and TradingView offer a wealth of insights and analytical tools.
In essence, the mastery of identifying and understanding the behavior of impulsive and corrective moves is instrumental for any aspiring trader or analyst. It forms the bedrock for informed trading decisions, aiding in navigating the complexities of financial markets with increased precision and awareness. By integrating this understanding into their trading endeavors, market participants enhance their prospects for success in an ever-evolving and dynamic trading environment.
This article was last updated on: September 4, 2026