
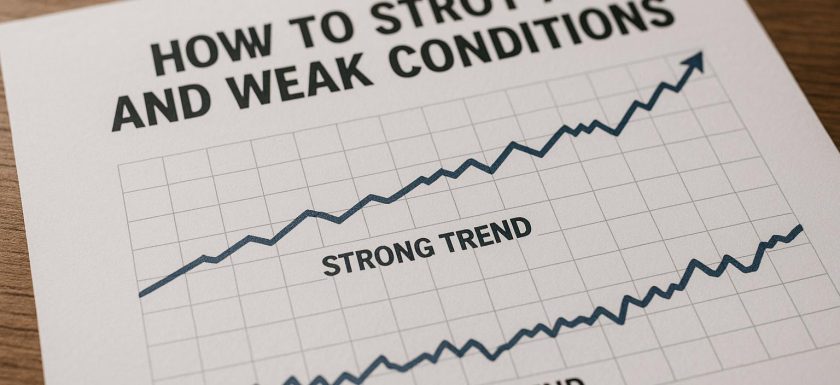
Understanding Trend Conditions in Financial Markets
In the ever-evolving landscape of financial markets, one of the critical competencies for traders and investors is the ability to discern trend conditions. Whether you are trading stocks, futures, currencies, or any other financial instruments, understanding trends is essential to making informed decisions. Trends represent the general direction of the price movement within the markets, and identifying these trends can significantly influence trading and investment strategies. This discussion will explore the features that define both strong and weak trend conditions and how these can be leveraged to enhance trading effectiveness.
Characteristics of Strong Trend Conditions
A market is said to be in a strong trend when it demonstrates sustained price movement in a particular direction with corroborative technical signals. These trends are indicative of market sentiment and can impact trading biases. Let’s explore the key attributes of strong trend conditions:
1. Higher Highs and Higher Lows
In the context of a bullish trend, one of the quintessential markers is the emergence of higher highs and higher lows over various time frames. This price behavior suggests that buyers are in control, consistently pushing prices higher, signaling robust market confidence.
2. Volume Confirmation
Volume is a pivotal component in assessing the strength of a trend. In a potent upward trend, volume tends to support the price movement, characterized by an increase in volume during price advances and a decrease during minor pullbacks or corrections. This pattern underscores the market’s conviction in the trend’s direction.
3. Moving Averages
Moving averages are integral tools for trend analysis. In a strong bullish trend, shorter-term moving averages, such as the 20-day Exponential Moving Average (EMA), typically maintain a position above longer-term moving averages like the 50-day and 200-day EMAs. This alignment confirms the market’s bullish bias.
4. ADX Indicator
The Average Directional Index (ADX) is a metric used to assess the strength of a trend. A reading above 25 indicates a strong trend, providing traders with quantifiable insights into the trend’s vitality without necessarily indicating its direction.
Examples of Strong Trend Indicators
When examining market charts, indicators of a strong trend can include the presence of long candlestick bodies on price charts, suggesting powerful directional movement. Technical setups, such as the narrowing of Bollinger Bands, can also suggest continuity in trend strength. The convergence of multiple technical indicators pointing in the same direction often confirms a persistent trend.
Weak Trend Conditions
Conversely, a weak trend is susceptible to frequent reversals and is characterized by an absence of a clear directional bias. Recognizing a weak trend involves monitoring several elements that may indicate fragility in the market’s trajectory:
1. Lack of Volume
In situations where a price movement occurs without the support of substantial trading volume, it often signals a weak trend. Significant price shifts accompanied by declining or negligible volume can suggest a potential lack of commitment among market participants, implying a false or unsustainable trend.
2. Price Consolidation
A weak trend might manifest through price consolidation, where the price fluctuates within a specific range without breaking significant support or resistance levels. Such patterns reflect market indecision, indicating a lateral or sideways movement without a pronounced trend direction.
3. Divergence
Divergence is a concept where there is a mismatch between the price movement and the signals from technical indicators, such as the Relative Strength Index (RSI) or Moving Average Convergence Divergence (MACD). For example, if the asset’s price reaches higher highs, but the RSI declines, this divergence could indicate a weakening trend and caution traders of potential reversals.
Key Takeaways for Traders
Before executing trades, comprehensively evaluating the strength of the trend is pivotal. By understanding whether a trend is gaining or losing momentum, traders can refine their entry and exit strategies, which can substantially affect their overall trading outcomes. It is prudent for traders to study trend indicators and tactics from credible financial education sources and market analysis platforms to augment their understanding of trend dynamics.
Continued Learning
Continuous market analysis and the use of reliable analytical tools are recommended for a deeper understanding of trend conditions. Platforms that provide advanced charting tools, technical indicators, and timely market updates can be instrumental in identifying and analyzing market trends. Keeping abreast of industry developments and honing analytical skills are vital for traders seeking to enhance their market acumen and trading proficiency.
This article was last updated on: July 31, 2026